
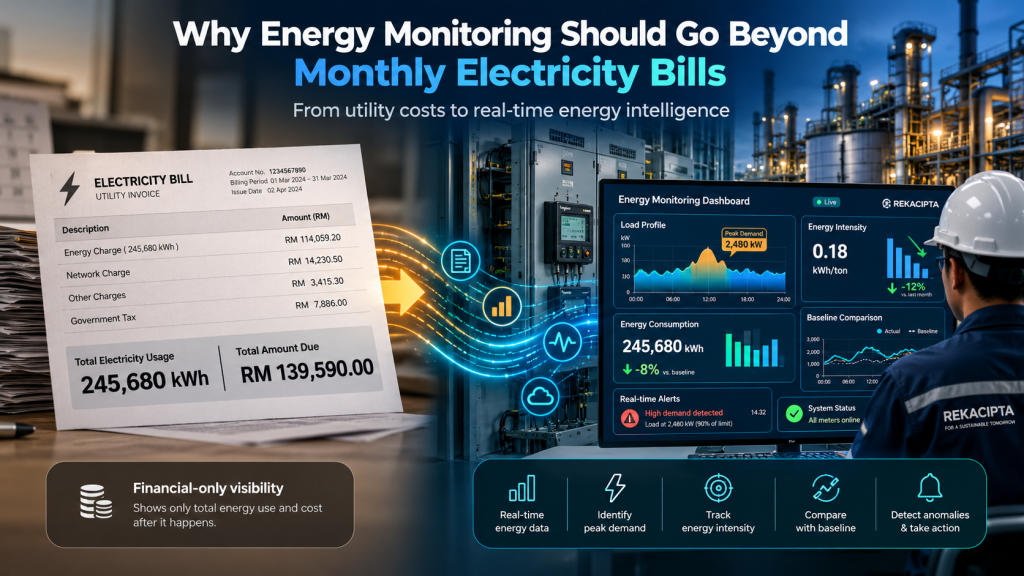
For many industrial facilities, energy management still begins and ends with one document:
the monthly electricity bill.
At the end of each billing period, management can see how many kilowatt-hours were consumed, how much electricity cost, and whether the bill increased or decreased compared with the previous month.
That information is important.
But it arrives too late and contains too little operational context to explain what actually happened inside the facility.
A monthly electricity bill can tell you:
How much energy did we buy?
It usually cannot tell you:
Where was the energy consumed?
When did abnormal consumption occur?
Which equipment caused it?
Was the increase caused by higher production or lower efficiency?
What created the peak demand?
Was equipment running unnecessarily?
Did yesterday’s improvement actually save energy?
This distinction is fundamental.
A utility bill is primarily a financial record.
An energy monitoring system should be a decision-making system.
And that is why meaningful industrial energy management must go beyond monthly electricity bills.
From Energy Accounting to Energy Management
Imagine a manufacturing facility receives the following information:
Monthly electricity consumption: 1,200 MWh
Monthly electricity cost: Rp 1.8 billion
Management notices that the cost is 9% higher than the previous month.
What should the engineering team do?
With only the electricity bill, several explanations are possible.
Production may have increased.
Operating hours may have increased.
Ambient temperature may have increased cooling demand.
One production line may have become less efficient.
Large motors may have been running unnecessarily.
Compressed-air leakage may have increased.
Equipment may have been operated outside its optimal region.
Power factor may have deteriorated.
Peak electrical demand may have increased.
Or electricity consumption may simply have followed normal production variation.
The bill tells us the result.
It does not explain the mechanism.
This is the difference between energy accounting and energy management.
Energy accounting asks:
“How much energy did we use?”
Energy management asks:
“Why did we use it, was it necessary, and what can we improve?”
The Standards Already Point in This Direction
ISO 50001:2018 provides the international framework for establishing and continually improving an Energy Management System, or EnMS. Its objective is not merely to record consumption, but to systematically improve energy performance, including energy efficiency, energy use, and energy consumption. The current edition was reconfirmed by ISO in 2024.
ISO 50006:2023 goes further by providing guidance for establishing and maintaining Energy Performance Indicators (EnPIs) and Energy Baselines (EnBs), including how organizations can measure, monitor, and demonstrate improvement in energy performance.
For electrical measurement itself, IEC 61557-12 defines requirements for Power Metering and Monitoring Devices (PMDs) used in industrial and commercial electrical distribution systems. These devices can measure and monitor electrical quantities beyond simple billing energy.
The direction is clear:
effective energy management requires measurement, baselines, indicators, monitoring, comparison, and continual improvement—not simply reading a monthly bill.
The Fundamental Problem: One Meter Hides Hundreds of Loads
A typical industrial facility may contain:
- production machines,
- pumps,
- compressors,
- cooling systems,
- HVAC,
- chillers,
- heaters,
- furnaces,
- conveyors,
- electrical motors,
- utility systems,
- lighting,
- laboratories,
- warehouses,
- office buildings,
- water-treatment systems,
- air compressors,
- cooling towers,
- wastewater treatment,
- and many other electrical consumers.
Yet all of those loads may eventually appear as a single number on the utility bill.
Suppose total plant consumption increases by 8%.
Where did the increase come from?
Without submetering or asset-level monitoring, the answer may be impossible to determine.
This is similar to managing a company using only its total monthly expenditure without knowing how much was spent on salaries, raw materials, logistics, maintenance, utilities, or capital projects.
The total is useful.
But the categories reveal where action is possible.
The same principle applies to electricity.
Energy Monitoring Needs Granularity
A useful energy-monitoring hierarchy may look like this:
Utility Incoming Supply
↓
Main Distribution
↓
Substation / Transformer
↓
Main Distribution Board / MCC
↓
Production Area
↓
Production Line
↓
Major Equipment
↓
Individual Critical Load
The correct monitoring depth depends on the business case.
It is rarely necessary to install meters on every single small electrical load.
Instead, organizations should identify Significant Energy Uses (SEUs) and loads where additional information could improve a decision.
For example:
- large compressors,
- cooling systems,
- process pumps,
- chillers,
- furnaces,
- large production machines,
- large motors,
- HVAC systems,
- utilities,
- data-center cooling,
- wastewater treatment,
- and other energy-intensive processes.
The objective is not maximum instrumentation.
The objective is sufficient visibility to explain energy behavior.
kWh Is Only One Part of the Story
Monthly electricity bills naturally focus attention on energy consumption.
But industrial electrical performance contains much more information.
A comprehensive monitoring system may include:
Energy — kWh
How much electrical energy was consumed?
Active Power — kW
How much real power is being used now?
Apparent Power — kVA
What electrical capacity is the system actually carrying?
Reactive Power — kvar
How much reactive power is flowing?
Power Factor
How effectively is electrical current being converted into useful real power?
Current — A
How heavily is equipment or a feeder loaded?
Voltage — V
Are voltage conditions stable and within acceptable ranges?
Demand
What is the maximum or interval load imposed on the electrical system?
Phase Unbalance
Are three-phase loads balanced?
Frequency
Is system frequency stable where relevant?
Harmonic Distortion
Are nonlinear loads affecting waveform quality?
Different parameters answer different engineering questions.
Energy monitoring therefore should not simply be understood as:
installing a kWh meter.
It is about understanding how electrical energy moves through the facility and how equipment uses it.
1. Identify Where Energy Is Really Going
The first advantage of granular monitoring is energy allocation.
Consider a plant consuming:
1,000 MWh per month
With only the main utility meter, we know the total.
With submetering, the picture might become:
- Production Line A: 310 MWh
- Production Line B: 220 MWh
- Compressed Air: 150 MWh
- Chilled Water System: 130 MWh
- Pumps and Utilities: 90 MWh
- HVAC and Buildings: 60 MWh
- Other Loads: 40 MWh
Immediately, management can see where the largest opportunities may exist.
This does not mean the largest consumer is automatically inefficient.
High energy consumption may simply reflect an energy-intensive process.
But it tells the engineering team where deeper investigation is most likely to produce meaningful results.
That is the beginning of evidence-based energy management.
2. Detect Energy Consumption When Nothing Is Being Produced
One of the simplest but most valuable analyses is the energy profile over time.
Consider a production line that operates from 07:00 to 19:00.
At 19:00, production stops.
But the power trend shows:
19:00–07:00 baseline load = 180 kW
Why?
Perhaps conveyors remain energized.
Hydraulic power packs continue operating.
Ventilation remains fully active.
Pumps continue circulating unnecessarily.
Air compressors continue cycling because of leakage.
Heating remains enabled.
Electrical panels remain powered despite no production requirement.
Each individual load may appear insignificant.
Together, they can create a substantial recurring energy cost.
A monthly electricity bill cannot easily expose this behavior.
A 24-hour power profile can expose it immediately.
3. Understand Base Load
Every facility has some amount of continuous electrical demand.
Some is necessary.
Servers, emergency systems, essential utilities, instrumentation, safety equipment, process circulation, critical ventilation, and other systems may need to operate continuously.
But part of the base load may also represent avoidable consumption.
A useful question is:
What is the minimum electrical power this facility actually requires when production is stopped?
Suppose the minimum technically necessary load is estimated at 350 kW.
But actual midnight consumption averages 520 kW.
The difference:
170 kW
deserves investigation.
If 100 kW of that difference can be eliminated for 10 hours every night:
100 kW × 10 h/day × 365 days
=
365,000 kWh/year
Even without changing any production equipment, monitoring has identified a potentially significant opportunity.
The insight comes not from total annual consumption.
It comes from understanding when energy is being used.
4. Peak Demand Can Matter as Much as Total Energy
Two facilities can consume the same monthly kWh while having very different electrical load profiles.
Consider:
Facility A
Load remains relatively stable at 1 MW.
Facility B
Load varies from 300 kW to 2.5 MW because several large machines frequently start or operate simultaneously.
Both might consume similar total energy over a month.
But Facility B imposes significantly different requirements on transformers, cables, switchgear, generators, UPS systems, and potentially the commercial electricity arrangement.
Peak-demand monitoring can identify:
- simultaneous startup of large equipment,
- unnecessary overlap between high-load processes,
- poorly coordinated production schedules,
- transient utility demand,
- and electrical infrastructure approaching capacity limits.
This creates a connection between energy monitoring and capacity management.
Sometimes monitoring shows that a planned electrical upgrade is necessary.
Sometimes it shows that an expensive upgrade can be postponed simply by better load scheduling.
That information can influence CAPEX decisions.
5. Energy Should Be Compared With Production
Absolute energy consumption can be misleading.
Suppose:
Month 1
Energy = 1,000 MWh
Production = 10,000 tonnes
Month 2
Energy = 1,080 MWh
Production = 12,000 tonnes
Energy consumption increased by:
8%
At first glance, Month 2 appears worse.
But energy intensity tells a different story.
Month 1:
1,000,000 kWh / 10,000 tonnes = 100 kWh/tonne
Month 2:
1,080,000 kWh / 12,000 tonnes = 90 kWh/tonne
Energy consumption increased.
But energy performance improved by approximately:
10% per tonne.
This is why energy management needs Energy Performance Indicators, not just total consumption.
ISO 50006 specifically provides guidance for developing EnPIs and energy baselines to evaluate changes in energy performance.
Relevant EnPIs might include:
- kWh / tonne product,
- kWh / batch,
- kWh / operating hour,
- kWh / m³ water treated,
- kWh / Nm³ compressed air,
- kWh / unit produced,
- cooling kWh / refrigeration ton-hour,
- or another indicator appropriate to the process.
The correct denominator gives energy consumption context.
6. Compare Similar Equipment
Industrial facilities frequently contain parallel or identical machines.
This creates an extremely powerful benchmarking opportunity.
Imagine three identical pumps operating under similar hydraulic conditions.
Their electrical power consumption is:
Pump A: 73 kW
Pump B: 75 kW
Pump C: 91 kW
Why is Pump C consuming substantially more power?
Possible explanations include:
- different process conditions,
- throttling,
- valve position,
- hydraulic restriction,
- impeller condition,
- bearing friction,
- misalignment,
- incorrect operating region,
- motor efficiency differences,
- instrumentation errors,
- or other mechanical issues.
Energy monitoring does not automatically diagnose the cause.
But it identifies the equipment that deserves engineering attention.
This is an important principle:
energy data can also become condition data.
7. Electrical Consumption Can Reveal Equipment Degradation
Energy monitoring and equipment reliability are often treated as separate subjects.
They are more connected than they appear.
A machine whose electrical load changes despite performing the same process duty may be telling us something.
Examples include:
A bearing begins deteriorating.
Mechanical losses increase.
Motor current and power may gradually increase.
A filter becomes blocked.
A fan must work harder to maintain required flow.
Power consumption changes.
A pump experiences changing hydraulic conditions.
Electrical load shifts.
A compressor develops leakage or efficiency degradation.
Runtime increases to produce the same amount of compressed air.
A chiller heat exchanger becomes fouled.
The system consumes more power for the same cooling output.
These relationships are not always simple enough for one electrical measurement to identify a specific failure.
But combined with operating context, energy data can contribute valuable evidence.
The same infrastructure used for energy management can therefore also support:
reliability monitoring.
8. Detect Equipment That Runs Longer Than Necessary
Not every energy problem is caused by poor machine efficiency.
Sometimes the equipment simply operates too long.
Consider two identical compressors.
Both have similar power consumption when running.
Compressor A runs:
12 hours/day
Compressor B runs:
18 hours/day
The question is not necessarily:
Why is Compressor B electrically inefficient?
The better question may be:
Why does Compressor B need six additional operating hours?
Possible explanations include:
- air leakage,
- poor sequencing,
- pressure setpoint differences,
- insufficient storage,
- control problems,
- process demand changes,
- or deterioration of compressor performance.
This demonstrates why monitoring should include more than instantaneous efficiency.
Operating duration itself is an energy parameter.
9. Measure the Effect of Operational Changes
Industrial facilities frequently implement energy-saving initiatives.
Examples include:
- reducing compressed-air pressure,
- modifying HVAC setpoints,
- optimizing motor operating schedules,
- installing variable-frequency drives,
- replacing inefficient motors,
- improving insulation,
- modifying pump control,
- repairing leaks,
- changing production schedules,
- optimizing cooling-water operation.
After implementation, a question must be answered:
Did the improvement actually work?
Without before-and-after data, the answer may be based largely on assumptions.
Continuous monitoring makes verification possible.
A simple workflow is:
Baseline
↓
Implement Improvement
↓
Monitor New Performance
↓
Normalize for Operating Conditions
↓
Compare Against Baseline
↓
Quantify Improvement
This transforms an energy-saving idea into a measurable engineering result.
Energy Baselines Are Critical
One of the most powerful concepts in energy management is the energy baseline.
A baseline defines expected energy performance under known operating conditions.
The simplest baseline may be:
Average daily energy consumption during the previous three months.
But industrial processes often require more sophisticated models.
Energy use may depend on:
- production rate,
- operating hours,
- product grade,
- ambient temperature,
- humidity,
- occupancy,
- process pressure,
- flow,
- batch composition,
- equipment configuration,
- or seasonal conditions.
Suppose a cooling system consumes more electricity during a particularly hot month.
Comparing raw kWh alone might incorrectly suggest deteriorating efficiency.
A better model could compare actual consumption with expected consumption at the corresponding ambient temperature and cooling demand.
This distinction becomes increasingly important as energy analytics become more sophisticated.
The question changes from:
“Did energy use increase?”
to:
“Did energy use increase more than it should have given the operating conditions?”
That is a far more powerful question.
From Thresholds to Anomaly Detection
Traditional monitoring often uses fixed limits.
For example:
Alarm when power > 100 kW.
That approach is useful where a clear engineering limit exists.
But efficiency deterioration may occur long before the equipment exceeds a fixed threshold.
Suppose a pump normally consumes:
72–76 kW
Over several weeks, its consumption gradually reaches:
84 kW
The absolute value may still be below a 100 kW alarm.
But compared with its historical baseline, the change is significant.
A smarter system might generate:
Power consumption is 11% above the 30-day operating baseline under comparable load conditions.
That is much more actionable.
Modern industrial analytics can combine:
- fixed thresholds,
- dynamic baselines,
- rate-of-change detection,
- rolling averages,
- peer comparison,
- operating-condition normalization,
- anomaly detection,
- and predictive models.
The goal is not artificial intelligence for its own sake.
The goal is to identify changes that deserve human attention.
Power Factor Deserves Visibility
Industrial facilities contain many inductive loads, particularly motors and transformers.
Poor power factor means greater current is required to deliver the same amount of useful real power.
Consider:
Real power = 800 kW
At power factor 0.95:
Apparent power ≈ 842 kVA
At power factor 0.75:
Apparent power ≈ 1,067 kVA
The real power requirement is unchanged.
But the electrical infrastructure carries substantially more apparent power and current.
Monitoring power factor by major distribution area can help identify:
- capacitor-bank problems,
- changing load characteristics,
- incorrect compensation,
- switching issues,
- or operating conditions creating unnecessary reactive power flow.
Again, the monthly bill may show the commercial consequence.
Real-time monitoring helps locate the engineering cause.
Voltage and Current Unbalance Matter Too
Three-phase systems ideally operate with balanced conditions.
In reality, phase loading can differ.
Monitoring individual phase voltage and current can reveal:
- uneven single-phase loading,
- feeder imbalance,
- connection problems,
- abnormal equipment behavior,
- or distribution issues.
Electrical imbalance can contribute to additional losses and heating.
From a reliability perspective, this creates another important connection:
energy monitoring can reveal conditions that influence equipment life.
An energy-monitoring system should therefore not be designed purely as an accounting system.
It can also function as part of the electrical asset-health architecture.
Harmonics and Power Quality: When Energy Monitoring Goes Deeper
Modern industrial facilities contain increasing numbers of nonlinear loads:
- variable-frequency drives,
- UPS systems,
- rectifiers,
- switch-mode power supplies,
- LED lighting,
- power electronics,
- chargers,
- and automation equipment.
These devices can distort current and voltage waveforms.
Basic energy monitoring and specialized power-quality monitoring are not exactly the same discipline, and IEC 61557-12 itself distinguishes general PMDs from dedicated power-quality instruments covered under the IEC 62586 family.
But an effective monitoring architecture should recognize when electrical behavior requires deeper investigation.
For some facilities, power-quality information may help explain:
- transformer heating,
- nuisance trips,
- capacitor problems,
- neutral-current issues,
- equipment malfunction,
- or unexpected electrical losses.
The appropriate level of instrumentation should follow the engineering problem being investigated.
From Monthly Reporting to Daily Operational Management
A traditional energy report might say:
Electricity consumption increased 6% this month.
A more actionable monitoring system might say:
Energy intensity increased 3.8% during Line 2 night-shift operation.
Or:
Compressor House B consumed 14% more energy per Nm³ of compressed air than its 30-day baseline.
Or:
Chiller 2 requires approximately 12% more power than Chiller 1 under comparable cooling load.
Or:
The plant maintained an unnecessary 125 kW base load for six hours following production shutdown yesterday.
The difference is profound.
The first statement informs management.
The others suggest where engineering should investigate.
Energy Monitoring Should Lead to Actions
A dashboard alone does not save energy.
This point is critical.
Organizations can install sophisticated meters and beautiful dashboards and still achieve almost no improvement.
Why?
Because measurement creates visibility.
Action creates savings.
An effective energy management workflow therefore needs four layers:
Layer 1 — Measurement
Capture reliable electrical and operational data.
Layer 2 — Context
Understand where, when, and under what conditions energy is consumed.
Layer 3 — Insight
Identify inefficiencies, abnormalities, deviations, and opportunities.
Layer 4 — Action
Change equipment, operating practice, maintenance strategy, control logic, production scheduling, or engineering design.
Then comes one final step:
Layer 5 — Verification
Measure whether the action actually improved performance.
The complete loop becomes:
Measure → Understand → Improve → Verify
This is consistent with the continual-improvement philosophy behind ISO 50001.
A Practical Example: Finding Hidden Base-Load Waste
Consider an industrial facility with the following observation.
Power demand during normal production:
2.4 MW
Expected load after production shutdown:
600 kW
Actual measured night load:
850 kW
Unexpected excess:
250 kW
Further investigation finds:
- one ventilation system: 70 kW,
- two circulation pumps: 90 kW,
- compressed-air losses causing extra compressor runtime: average 60 kW,
- miscellaneous unnecessary loads: 30 kW.
Total:
250 kW
If this condition exists for eight hours per day:
250 kW × 8 h = 2,000 kWh/day
Over 350 operating days:
700,000 kWh/year
If the effective electricity cost were hypothetically Rp 1,500/kWh:
700,000 × Rp 1,500
=
Rp 1.05 billion/year
The important point is not the hypothetical tariff.
The important point is that the opportunity was invisible in the monthly total but obvious in the time-series profile.
Energy Data Can Improve CAPEX Decisions
Monitoring does not only reduce OPEX.
It can also improve investment decisions.
Suppose engineers believe a transformer is approaching its capacity limit.
A traditional approach might use:
- nameplate load,
- installed capacity,
- maximum theoretical demand,
- and occasional manual readings.
Continuous load monitoring may reveal that actual transformer utilization rarely exceeds 55%.
Perhaps the supposed capacity problem is caused only by short peaks.
The engineering solution may therefore be:
- load sequencing,
- process scheduling,
- demand management,
- or redistribution of loads,
rather than immediate transformer replacement.
The opposite is also possible.
Monitoring may reveal sustained loading, increasing demand, thermal stress, and insufficient remaining capacity.
In that case, data strengthens the business case for the upgrade.
Either way:
better data improves CAPEX quality.
Energy Monitoring Can Support Carbon Accounting—but Do Not Confuse the Two
Electricity consumption often contributes directly to organizational greenhouse-gas accounting.
Better metering therefore improves the granularity of energy-related emissions information.
Organizations can potentially understand:
- which site contributes most,
- which process is most energy intensive,
- which efficiency project produced the greatest reduction,
- and whether energy-related sustainability targets are improving.
But energy monitoring and carbon accounting are not identical.
Electricity consumption is a physical measurement.
Carbon emissions require the relevant emissions factors and accounting methodology.
The distinction should remain clear.
Nevertheless, reliable energy data is the foundation upon which credible energy-related sustainability metrics are built.
Start With Significant Energy Uses, Not Thousands of Meters
A common mistake is assuming that digital energy management requires monitoring everything immediately.
It does not.
A stronger approach is:
1. Understand the utility bill.
Know tariff structures, total consumption, demand behavior, and historical trends.
2. Map major electrical consumers.
Identify where most energy is likely being used.
3. Identify Significant Energy Uses.
Focus on loads with high consumption, high operating hours, or meaningful improvement potential.
4. Define the question.
Examples:
Why is compressed-air consumption increasing?
Which production line has the highest energy intensity?
What causes our peak load?
Why does night-shift base load remain high?
5. Install or integrate the necessary metering.
Measure only what is required to answer useful questions.
6. Build baselines and EnPIs.
Compare performance under relevant conditions.
7. Generate insights and alarms.
Identify deviations early.
8. Assign actions.
Someone must own the response.
9. Verify results.
Confirm that the improvement actually changed performance.
Then expand the monitoring architecture as value is demonstrated.
The Energy-to-Decision Chain
A useful way to think about energy digitalization is:
Meter
↓
Data
↓
Context
↓
Baseline
↓
Deviation
↓
Insight
↓
Action
↓
Verified Saving
Installing a meter completes only the first step.
A dashboard completes only part of the process.
The actual business value sits at the bottom of the chain.
What Should an Industrial Energy Dashboard Actually Show?
A useful dashboard should help the user answer questions quickly.
At management level, that might include:
- total energy consumption,
- cost trend,
- energy intensity,
- peak demand,
- EnPI performance,
- savings versus baseline,
- major energy consumers,
- and abnormal deviations.
At engineering level, it might include:
- feeder or equipment power,
- voltage,
- current,
- power factor,
- demand,
- load profile,
- phase balance,
- operating hours,
- peak events,
- and relevant power-quality indicators.
At asset level, it might include:
- current operating load,
- historical baseline,
- comparison with peer equipment,
- abnormal consumption,
- trend direction,
- and operating-state correlation.
Different people need different levels of information.
The objective is not to place every electrical parameter on one screen.
The objective is to make the next decision easier.
From Dashboard to Smart Energy Insights
Industrial monitoring becomes significantly more useful when the system automatically interprets patterns.
Instead of showing:
Compressor Power: 185 kW
an insight layer might state:
Compressor power is normal, but runtime increased 18% during the last seven days for similar production demand.
Instead of:
Plant Load: 1.26 MW
it might state:
Overnight base load is 140 kW above the previous 30-day baseline.
Instead of:
Power Factor: 0.82
it might state:
Power factor has remained below 0.85 for 42 minutes in MCC-3. Check reactive-power compensation status.
Instead of:
Energy today: 32.4 MWh
it might state:
Energy intensity is 7.2% higher than expected for today’s production volume.
This represents a transition from:
data visualization
to:
decision support.
And that is where industrial energy monitoring begins to create much greater business value.
How Rekacipta Approaches Energy Monitoring
At Rekacipta, we believe energy monitoring should answer engineering and business questions—not simply display electrical numbers.
A useful system should help organizations understand:
Where is energy being consumed?
When is it being consumed?
Which equipment is responsible?
Is consumption normal for the operating condition?
What has changed?
Where is the improvement opportunity?
Did the improvement actually work?
Solutions such as PowerWatch and the Siteplore monitoring and analytics layer can be positioned around this philosophy: converting electrical measurements into operating visibility, baselines, trends, alerts, and actionable insights.
The objective is not simply to digitize the electricity meter.
It is to connect electrical information with operational context.
Because a reading of:
450 kW
has limited meaning by itself.
But:
“Power demand is 450 kW—70 kW above the normal baseline for this production condition”
is information that can trigger a decision.
That difference is the essence of industrial intelligence.
The Monthly Electricity Bill Is the End of the Story, Not the Beginning
A utility bill remains important.
It tells the organization what electricity ultimately cost.
It provides the financial outcome of thousands of operating decisions made throughout the month.
But by the time the bill arrives, those decisions have already happened.
Motors have already operated.
Compressors have already cycled.
Chillers have already consumed electricity.
Peak demand has already occurred.
Unnecessary loads may have already run for hundreds of hours.
The electricity bill tells us what happened financially.
Energy monitoring tells us how it happened operationally.
And that distinction determines whether an organization can actually improve.
The future of industrial energy management is therefore not simply:
Measure more electricity.
It is:
Measure the right variables, establish the right baseline, identify abnormal behavior, understand the operating context, take action, and verify the outcome.
Because the most valuable energy data is not the number printed on the monthly bill.
It is the information that allows someone to change the next month’s result before the next bill arrives.
References and Technical Framework
ISO 50001:2018 — Energy management systems — Requirements with guidance for use. Provides the international framework for establishing, implementing, maintaining, and continually improving an Energy Management System and energy performance. The current edition was reviewed and confirmed in 2024.
ISO 50006:2023 — Energy management systems — Evaluating energy performance using energy performance indicators and energy baselines. Provides guidance for developing, using, and maintaining Energy Performance Indicators and Energy Baselines and for demonstrating improvement in energy performance.
IEC 61557-12:2018+A1:2021 — Power Metering and Monitoring Devices. Defines requirements for PMDs used to measure and monitor electrical quantities in industrial and commercial electrical distribution systems.
ISO 50001 Energy Management Framework. ISO describes the standard as a continual-improvement framework for improving energy use and supporting more systematic energy management across organizations.